Measure with Clarity, Count on Confidence.
Proper controls are the foundation of high-quality flow cytometry. A well-designed experiment includes samples that define
background fluorescence and inform gating. Essential controls include unstained cells, single-stained controls, fluorescence-
minus-one (FMO) controls, isotype controls, viability dyes, and biological positive/negative samples. Each control contributes
uniquely to distinguishing true signal from background:
- Unstained cells: Sample without any fluorescent label, measuring cells’ autofluorescence and instrument baseline. Running
an unstained control sets the baseline in each channel and ensures gates exclude inherent noise, so that any detected
signal in experimental samples reflects specific staining.
- Single-stained controls: Each sample is stained with only one fluorochrome. This reveals spectral spillover between
channels. Single-color controls allow calculation of a compensation matrix to subtract the overlap. After compensation,
each dye’s signal is confined to its intended channel, preventing false double-positive signals.
- Fluorescence-minus-one (FMO) controls: Each FMO contains all fluorochromes except one (e.g., FITC+APC, no PE). The
FMO shows the background distribution in the missing channel due to all other dyes. FMOs are essential for gating in
multicolor panels: the FMO defines where negative cells lie, ensuring that gates exclude background spillover and include
only true positives.
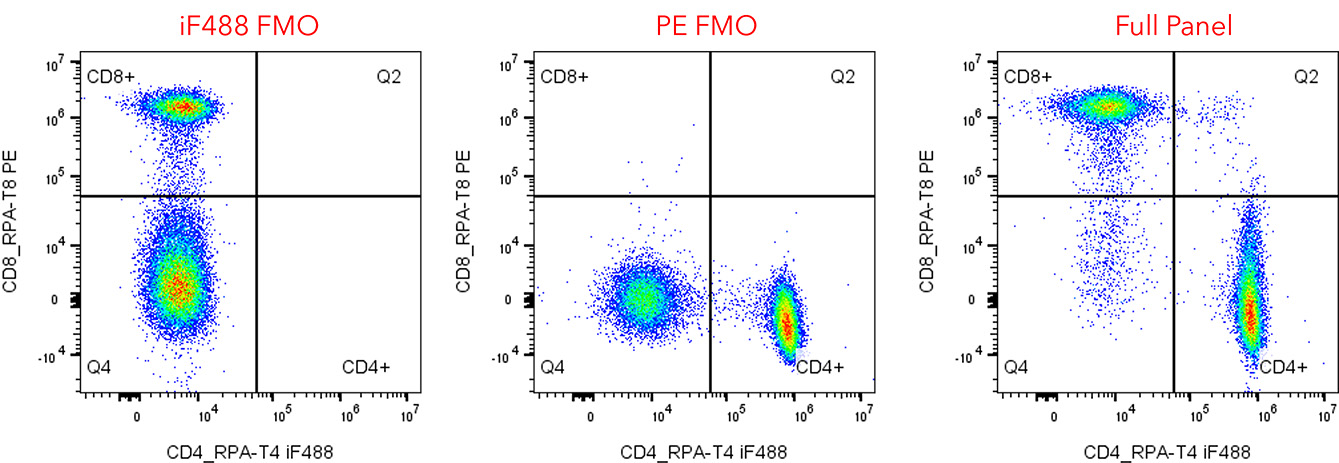
Fig. 1. Fluorescence-minus-one (FMO) gating example. Dot plots of iF488-FMO and PE-FMO controls used to gate for positive
staining. The FMO background fluorescence correctly excludes cells that are truly negative for iF488 and PE.
- Isotype controls: Non-specific antibodies matching the class and fluorochrome of the test antibodies. They measure
nonspecific binding and Fc-mediated background. A high isotype signal indicates excessive background or sticky binding.
Isotypes should not be used to define positive gates (they often overestimate background) but can flag staining artifacts.
- Viability dyes (live/dead): Impermeant dyes like propidium iodide or amine-reactive dyes label dead cells brightly. Dead
cells bind antibodies nonspecifically and have high autofluorescence. Including a viability stain and gating out the dead-cell
population removes these artifacts, ensuring analysis focuses only on live cells.
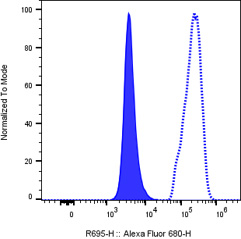
Fig. 2. Viability dye staining. A histogram plot showing low staining of A-431
live cells (blue filled histogram) versus dead cells (blue dotted line histogram)
with Near IR Live/Dead stain. Removing dead cells from analysis prevents their
high autofluorescence and nonspecific staining from skewing the results.
- Biological controls: Real samples known to lack (negative control) or express (positive control) the target marker. For
example, a knockout or untreated sample as a negative, and stimulated cells as positive. Process these like test samples.
Negatives define the background population, and positives confirm where real positive cells should appear.
Fig. 3. Isotype and biological controls. Left: Histogram overlay of a specific marker (solid line) and its matched isotype control
(dashed line) on the same sample. The low isotype signal indicates minimal nonspecific binding, ensuring the positive signal is
specific. Right: two histograms comparing a negative biological control (gray dotted line) versus a positive control (blue) for the
marker. The clear separation ensures validity of gate placement.
Strategies for Reducing Variability and Enhancing Reproducibility
Implement systematic practices at every step to minimize variability:
- Instrument quality control: Calibrate the cytometer regularly with standard fluorescent beads to ensure consistent laser
alignment and detector sensitivity. Keep instrument settings (voltages, gains) constant across runs and log performance
metrics. A well-calibrated instrument produces comparable data day-to-day.
- Reagent consistency: Use validated antibodies and titrate each for optimal signal. Work from a single antibody lot or
prepare large aliquots to minimize lot-to-lot variation. Store reagents properly (protect from light and extreme
temperatures) and avoid expired stock. Stable, high-quality reagents help keep staining consistent.
- Standardized protocols: Follow detailed SOPs for sample preparation and staining. Fix incubation times, cell numbers, and
buffer conditions. Always gate in a consistent order (e.g. cells → singlets → live cells → markers). Uniform procedures
minimize technical variation between experiments and operators.
- Consistent analysis workflow: Apply the same data processing steps each time. Always calculate compensation from that
experiment’s single-color controls. Use consistent data transformations and gating templates. Analyze samples blinded to
experimental groups when possible to reduce bias. Collect sufficient events (especially for rare populations) and document
all settings. This consistency ensures results are comparable across runs.
By combining strict instrument QC, stable reagents, and disciplined procedures, laboratories can greatly reduce technical
variability. Consistent use of controls and procedures means that any anomalies become apparent and can be corrected early.
Common Pitfalls and How to Avoid Them
Even experienced users can fall into these traps:
- Skipping viability gating: Dead cells bind antibodies nonspecifically and fluoresce strongly. Always include a viability dye
and gate out dead cells immediately.
- Miscompensation: Not using fresh single-color controls (or reusing old matrices) can distort results. Always run single-
stained controls each experiment to calculate compensation and ensure spillover is corrected.
- Poor gating controls: Setting gates without FMOs (or using isotypes as gates) risks misclassification. In multicolor panels,
use FMOs to define gates that exclude fluorescence spread, ensuring only true positives are counted.
- Flawed panel design: Overloading a panel with many similar-spectrum dyes causes extreme spillover. Pair dim antigens
with bright fluorochromes and test new panels on control cells to spot problematic overlaps before running samples.
- Instrument drift: Assuming stable instrument performance without checks is risky. Skipping daily QC beads means drift can
go unnoticed. Run QC beads each day and pause experiments if performance falls out of range.
- Inconsistent protocols: Varying staining or acquisition procedures (antibody concentrations, incubation times, cell counts)
between runs introduces variability. Stick to SOPs carefully. If anything changes, include overlap controls to confirm
consistent results.
- Suboptimal reagents: Not all antibody conjugates are equal, so find the reagents that provide the best stain index for your
target and yield the most consistent results. Never use expired reagents and be aware of potential tandem dye breakdown.
Being aware of these pitfalls and planning ahead with proper controls helps prevent wasted samples and unreliable data.
Intracellular Staining and Rare-Event Considerations
The same control principles apply to intracellular assays, with some added points. Fixation and permeabilization often
increase cell autofluorescence and alter scatter. Include a fixable viability dye before permeabilization so that live/dead
discrimination still works after fixation. Prepare compensation and FMO controls using samples treated identically (including
fixation).
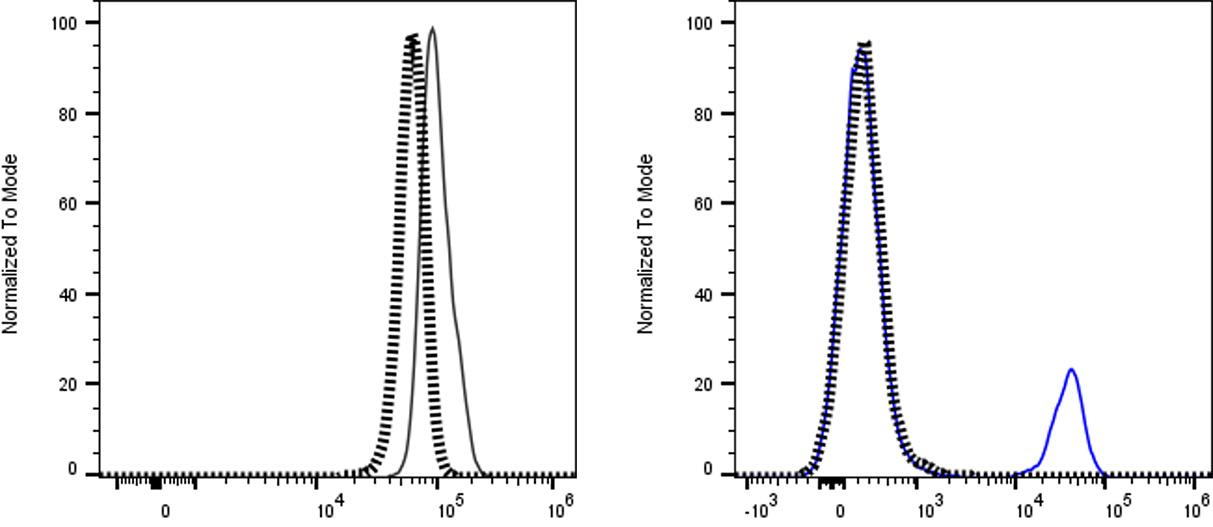
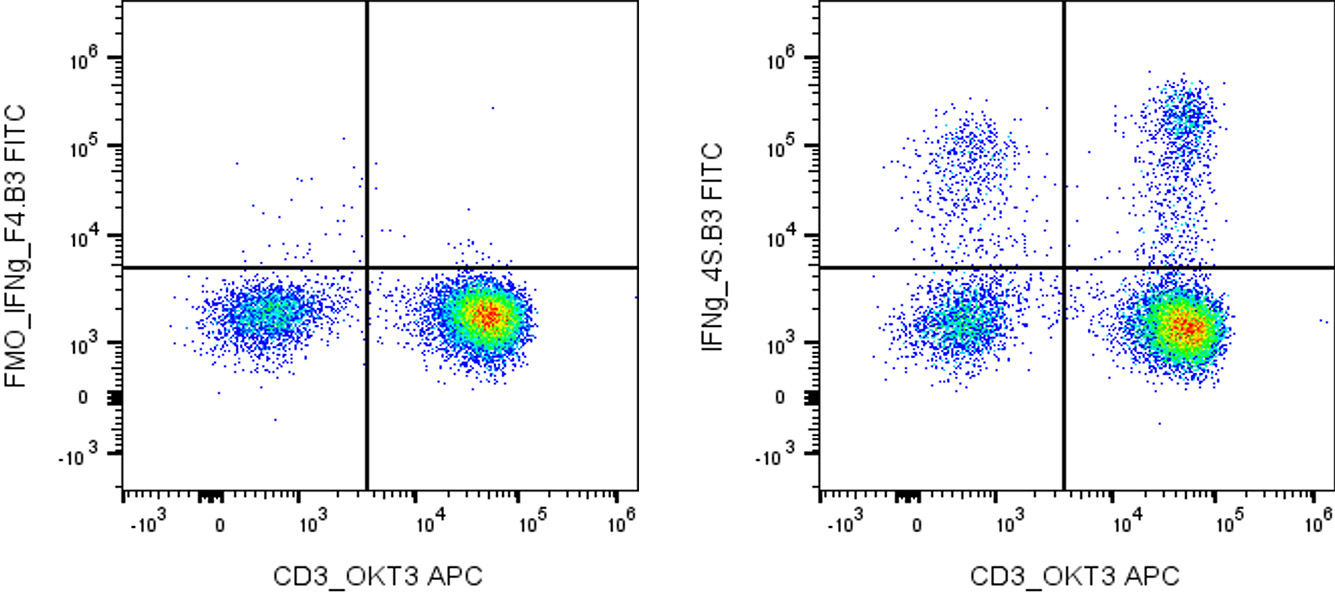
Fig. 4. Intracellular staining example with controls. Plots of IFNγ cytokine staining after stimulation. Left: the IFNγ-FMO control
(omitting the IFNγ antibody) is used to define the positive gates. The FMO-defined gate excludes cells without true IFNγ
signal. (A fixable viability control, not shown, would exclude dead cells.) Right: Positively stained cells detected with IFNγ
antibody.
Rare-event detection (e.g., antigen-specific T cells or minimal residual disease cells) demands high sensitivity. Acquire very
large total event counts or enrich the sample if possible. Use “dump channels” (combining multiple unwanted markers in one
channel) to reduce background noise. Critically, set gates based on FMO controls for each marker: when true positives are
rare, even minor background spillover can mimic a signal. An FMO-based gate ensures that only cells above true background
levels are counted.
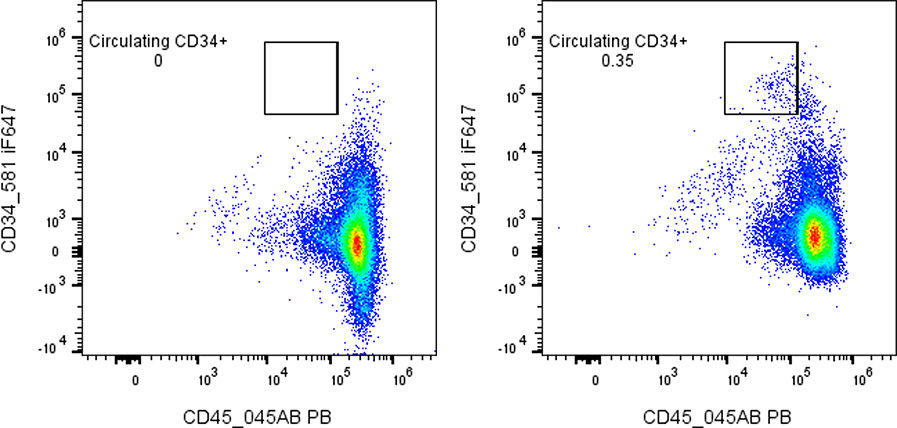
Fig. 5. Rare-event gating. Dot plot illustrating a very small population of 34+ precursor cells (gated) within a large background
of other cells. An FMO control was used to set the tight gate around the true positives. Collecting a large number of total
events increases confidence that the circled cells represent genuine positive events above background.